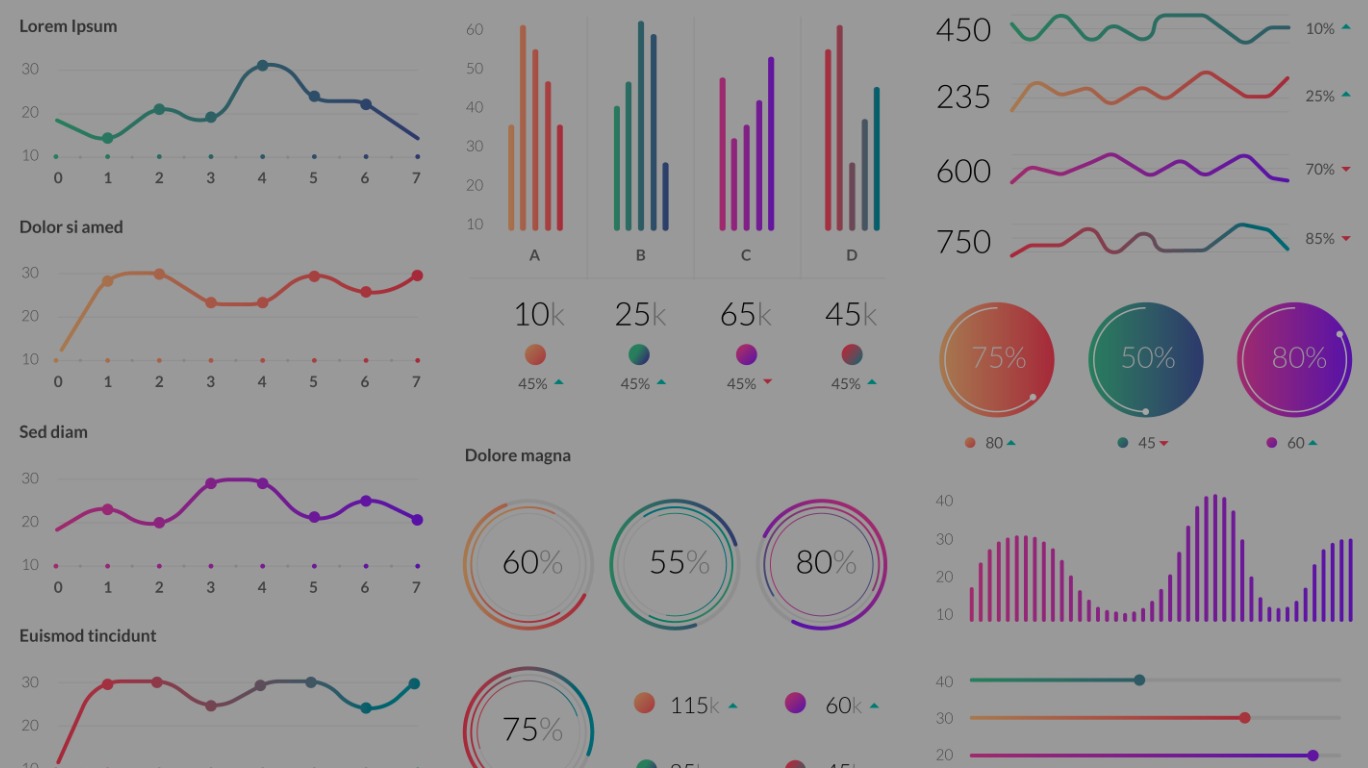
Supply Chain KPI Dashboards are crucial in modern supply chain management, offering real-time insights and data-driven decision-making capabilities. In this blog, we’ll explore the significance of data visualization within these dashboards and how it transforms supply chain performance.
Supply chains are the backbone of businesses, ensuring the seamless flow of goods and services. Any disruption in this flow can have far-reaching consequences, making monitoring and optimizing supply chain performance imperative. Supply Chain KPI Dashboards are designed to achieve just that. These interactive visual tools provide real-time insights into various aspects of the supply chain, allowing organizations to make informed decisions.
The importance of data visualization within supply chain management cannot be overstated. Complex supply chain data, when presented effectively, empowers organizations to streamline processes, reduce costs, enhance customer satisfaction, and gain a competitive edge.
Supply Chain KPI Dashboards are dynamic, interactive tools that display key performance indicators related to the supply chain. They offer a comprehensive view of supply chain activities, allowing organizations to monitor and measure various metrics, from inventory levels and order fulfillment to transportation costs and lead times.
The primary purpose of these dashboards is to provide real-time insights into the performance of the supply chain. They help organizations track and measure KPIs, identify bottlenecks, and make data-driven decisions to optimize the supply chain’s efficiency and effectiveness.
The power of data visualization lies in its ability to simplify complex data. Data visualization is invaluable for supply chain management, which involves multiple processes and variables. It takes raw data and transforms it into easily understandable charts, graphs, and visuals, making it easier for decision-makers to grasp the bigger picture.
By presenting data visually appealing and intuitively, data visualization helps organizations identify trends, anomalies, and areas needing improvement. It bridges the gap between raw numbers and actionable insights.
Improved Decision-Making: Data visualization enables quicker, more informed decisions. Decision-makers can instantly interpret data, identify areas of concern, and strategize for improvements.
Enhanced Efficiency: Supply chain KPI dashboards improve efficiency by providing real-time insights. This helps reduce delays, avoid disruptions, and optimize operations.
Better Performance: Visualizing KPIs promotes accountability and encourages teams to meet performance targets, improving supply chain performance overall.
Various data visualization techniques can be applied to Supply Chain KPI Dashboards. These include bar charts, line graphs, heat maps, scatter plots, and geospatial visualizations. The choice of visualization method depends on the specific KPIs and the insights required.
Creating effective KPI dashboards involves a structured process:
Data Collection: Gather relevant data from various sources in the supply chain.
Data Preparation: Clean, organize, and structure the data for visualization.
Visualization Design: Choose appropriate visualization techniques for the KPIs.
Interactive Dashboard Development: Create an interactive and user-friendly dashboard.
Monitoring and Iteration: Continuously monitor KPIs and update the dashboard as needed.
To create compelling data visualizations for Supply Chain KPI Dashboards, follow these best practices:
- Keep it simple and intuitive.
- Choose the right visualization type for the data.
- Use color coding effectively.
- Ensure data accuracy and consistency.
- Make the dashboard user-friendly.
- Provide context for KPIs.
As technology advances, so will the field of data visualization in supply chain management. Future trends may include using artificial intelligence for predictive analytics, real-time data streaming, and more immersive and interactive visualizations. Visualization tools will continue to evolve to meet the demands of a rapidly changing supply chain landscape.
Supply Chain KPI Dashboards, powered by data visualization, offer a gateway to success in modern supply chain management. They provide a clear, real-time view of critical KPIs, allowing organizations to make informed decisions and optimize operations. As data visualization techniques continue to advance and supply chain technology evolves, these dashboards will play an even more pivotal role in shaping the future of supply chain management. Organizations must embrace these tools to stay competitive, harnessing the power of data visualization for a brighter, more efficient supply chain future.


